ClickHouse® and Python: Jupyter Notebooks

Jupyter Notebooks are an indispensable tool for sharing code between users in Python data science. For those unfamiliar with them, notebooks are documents that contain runnable code snippets mixed with documentation. They can invoke Python libraries for numerical processing, machine learning, and visualization. The code output includes not just text output but also graphs from powerful libraries like matplotlib and seaborn. Notebooks are so ubiquitous that it’s hard to think of manipulating data in Python without them.
ClickHouse support for Jupyter Notebooks is excellent. I have spent the last several weeks playing around with Jupyter Notebooks using two community drivers: clickhouse-driver and clickhouse-sqlalchemy. The results are now published on Github at https://github.com/Altinity/clickhouse-python-examples. The remainder of this blog contains tips to help you integrate ClickHouse data to your notebooks.
Driver Installation
You can run Jupyter Notebooks directly from the command line but like most people I run them using Anaconda. We’ll assume you know how to run Jupyter from Anaconda Navigator. (If not, read the Anaconda docs and come back.) To use the ClickHouse drivers you’ll want to run conda commands similar to the following to bring them into your environment. This example uses the ‘base’ environment.
# List environments and pick ‘base’ environment.
conda info --envs
conda activate base
# Add python libraries.
conda install -c conda-forge clickhouse-driver
conda install -c conda-forge clickhouse-sqlalchemy
Now when you start Jupyter with the ‘base’ environment you’ll have ClickHouse drivers available for import. Tip: you can run these commands to load modules while Jupyter is already running. I do this regularly to top up missing libraries.
There are other Python drivers available such as the sqlalchemy-clickhouse driver developed by Marek Vavrusa and others. However, the drivers shown above are available on conda-forge which makes them easy to use with Anaconda.
So much for installation. Let’s put the drivers to use.
Shortest Path to Data
The easiest way to work on data from ClickHouse is via the SQLAlchemy %sql magic function. There is a sample notebook that shows how to do this easily. For now let’s step through the recipe since this likely to be the most common way many users access data from ClickHouse.
First, let’s load SQLAlchemy and enable the %sql function.
from sqlalchemy import create_engine
%load_ext sql
Next, let’s connect to ClickHouse and fetch data from the famous Iris data set into a pandas data frame. The last command shows the end of the frame so we can confirm it has data.
%sql clickhouse://default:@localhost/default
result = %sql SELECT * FROM iris
df = result.DataFrame()
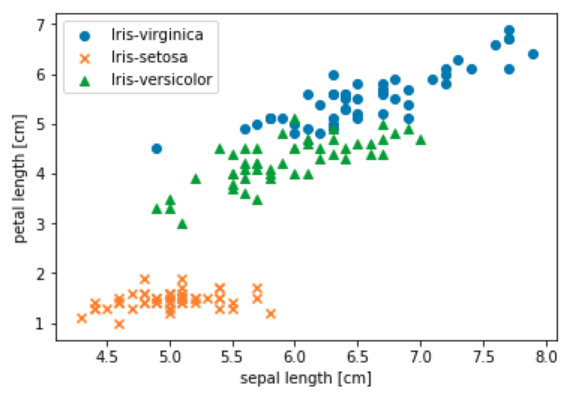
df.tail()Finally, let’s create a nice scatter graph with some of the data. This code is the most complex by far but generates a nice picture showing the overlap between characteristics of the three Iris species.
import matplotlib.pyplot as plt
%matplotlib inline

# Break up the data frame and graph each species separately.
species = df.species.unique()
markers = ['o', 'x', '^']
for i in range(3):
    df_segment = df[df['species'] == species[i]]
    plt.scatter('sepal_length',
                'petal_length',
                data=df_segment,
                marker=markers[i],
                label=species[i])
# Add proper labels and show the result.
plt.xlabel('sepal length [cm]')
plt.ylabel('petal length [cm]')
plt.legend(loc='upper left')
plt.show()
The result is the very satisfactory graph shown below.

For more details and to run the sample yourself check out the source notebook file.
Translating Data Types
One of the issues you’ll need to watch for in your own work is ensuring that pandas data frames have correct data types, especially numbers. If your SQL schema sticks with ints and floats, values will convert easily in result sets. More specialized types like Decimal do not automatically convert to numeric types, which means that libraries like matplotlib and scikit-learn won’t be able to use them correctly. Here’s an example of properly conforming DDL for the iris table:
CREATE TABLE default.iris (
  sepal_length Float64,
  sepal_width Float64,
  petal_length Float64,
  petal_width Float64,
  species String
) ENGINE = Memory()
It’s a good idea to run DataFrame.describe() on data frames created from SQL to ensure you got it right and that values have the expected types.
df.describe()
       sepal_length  sepal_width  petal_length  petal_width
count    150.000000   150.000000    150.000000   150.000000
mean       5.843333     3.057333      3.758000     1.199333
std        0.828066     0.435866      1.765298     0.762238
min        4.300000     2.000000      1.000000     0.100000
25%        5.100000     2.800000      1.600000     0.300000
50%        5.800000     3.000000      4.350000     1.300000
75%        6.400000     3.300000      5.100000     1.800000
max        7.900000     4.400000      6.900000     2.500000
The key thing to check for is that numeric columns are really numbers and not ‘object’ or ‘str’ values. You’ll of course notice problems with as soon as you try to put values in a graph or feed them to numerical libraries. For example, Matplotlib does not correctly plot X and Y axes for non-numeric data. That said, the root cause can be confusing to diagnose if you have not see it before.
Pandas has methods that allow you to patch up mismatched types but it’s easier to get things right in the schema to begin with.
Direct Use of ClickHouse Drivers
The %sql function is great if you are just accessing data and need to get it into a data frame. But what if you want to do more than just look at query results? %sql cannot run DDL or insert values. In this case you can import clickhouse-driver and clickhouse-alchemy entities and call them directly from notebook code. Here’s a trivial example:
from clickhouse_driver import Client
client = Client('localhost')
result = client.execute('SELECT now(), version()')
We documented use of the clickhouse-driver in depth in a previous Altinity blog article. You can look there for a general overview of the driver. The EX-1.0-Getting-to-Know-the-Clickhouse-driver-Client.ipynb notebook contains samples showing how to run DDL, select data, and load CSV.
Use of the clickhouse-sqlalchemy driver is illustrated in the EX-2-ClickHouse-SQL-Alchemy.ipynb notebook. We have not done a full review on the driver but based on initial experience it seems to work as well as the clickhouse-driver module, on which it depends. The main committer is Konstantin Lebedev (@xzkostyan), who also developed clickhouse-driver. You can also look at the documentation in the Github project. Between the notebook samples and the project README users who have previously used SQLAlchemy should have little problem undertstanding it.
Relatively few problems popped up during notebook development. I have not run into driver operations that work elsewhere but fail in Jupyter. Driver behavior in Jupyter appears 100% equivalent to running Python3 from the command line. We expect this of course but it’s still good when it happens. The most interesting problems so far were related to data conversions, which are a typical integration issue.
Lessons from Jupyter and ClickHouse
There is a natural symbiosis between ClickHouse and Python libraries like pandas and scikit-learn. Notebooks are very helpful for exploring the relationship in a systematic way.
Over the last few weeks I have noticed ways to combine capabilities from both sides effectively. Here are two simple examples that popped up relating to pandas data frames.
Going from SQL to Pandas. Data frames can manipulate data in ways that are difficult to do in ClickHouse. For example, you select normalized array data from ClickHouse data frame, then use the DataFrame.pivot_table() method to pivot rows and columns. See the EX-4-Pivot-Using-SQL-And-Pandas.ipynb for an example of how to do this.
Going from Pandas to SQL. I documented CSV loading in the clickhouse-driver using the csv.DictReader in my last blog article. It turns out that Pandas has a much better CSV reader than the native Python csv module. Among other things it converts numeric types automatically. This is now part of the clickhouse-driver notebook.
I’m sure there are many other ways to use Jupyter Notebook creatively with ClickHouse. If you have additional samples or see problems with those already there, please submit a PR on Github. Having a centrally located library of nice Python samples for ClickHouse will help all users.
ClickHouse® is a registered trademark of ClickHouse, Inc.; Altinity is not affiliated with or associated with ClickHouse, Inc.
Thanks for this!
In Postgres, sqlalchemy can infer table schema from a pandas dataframe, and create and populate a table with one to_sql() call – is something like that available for Clickhouse too?
You can load in one command but pandas does not pass in enough information to create the table properly. I would do it this way. First, create a table list this in ClickHouse.
CREATE TABLE users (`index` Int64, `name` String) ENGINE = TinyLog
Now you can run the following code.
from sqlalchemy import create_engine
import pandas as pd
url = ‘clickhouse+native://localhost/default’
engine = create_engine(url, echo=False)
df = pd.DataFrame({‘name’ : [‘User 4’, ‘User 5’, ‘User 37’]})
print(df)
df.to_sql(‘users’, con=engine, if_exists=’append’)
engine.execute(“SELECT * FROM users”).fetchall()
This prints out the values for me.