ClickHouse® Crushing Time Series

Once upon a time, we spotted TSBS (https://github.com/timescale/tsbs) — Time Series Benchmark Suite, started by InfluxDB engineers and polished to perfection by TimescaleDB team. The suite allows to compare apples-to-apples when testing different databases: it is a framework to generate test data, load it to different databases, run test queries, and collect statistics to analyze. We could not resist adding ClickHouse to the list of supported databases. It turned out that ClickHouse — being a general purpose analytical DBMS — stands very well against proven time series databases. Those benchmarks highlighted the strengths and weaknesses of different technologies. Interested? Let’s dig into details.
Time Series Benchmark Suite (TSBS)
TSBS is a collection of tools and programs that are used to generate data and run write and read performance tests on different databases. It is designed to be extensible in order to benchmark different use cases. Since it has been originally developed by time series folks it currently supports only one use case: collection and reporting on operational metrics. The particular test we were using generates test data for CPU usage, 10 metrics per time point. In total, we generated 100M rows from 4000 devices (hosts), as it is suggested on the main documentation page. This is certainly configurable.
TSBS supports several databases, and we run benchmarks for TimescaleDB, InfluxDB, and ClickHouse at the same hardware and test settings. We used Amazon r5.2xlarge instance for all tests. Those instances have 8 vCPUs, 64GB RAM and EBS storage. We did not change any configuration and used out-of-the-box settings for tested databases. It took us some time to adopt TSBS for ClickHouse, in particular, we had to program corresponding adapters for data load, and rewrite queries. Our pull request is still being reviewed by TimescaleDB team. We will discuss those implementation details in the separate article.
Data Structure
In ClickHouse we created two tables for this benchmarks.
1) Metrics table. It is sorted by tags_id and created_at in order to provide optimal performance when looking at single tags_id.
CREATE TABLE benchmark.cpu (
        created_date Date DEFAULT today(),
        created_at DateTime DEFAULT now(),
        time String,
        tags_id UInt32,
        usage_user Float64,
        usage_system Float64,
        usage_idle Float64,
        usage_nice Float64,
        usage_iowait Float64,
        usage_irq Float64,
        usage_softirq Float64,
        usage_steal Float64,
        usage_guest Float64,
        usage_guest_nice Float64,
        additional_tags String DEFAULT ''
        ) ENGINE = MergeTree(created_date, (tags_id, created_at), 8192);
2) Tags table with host specific properties:
CREATE TABLE benchmark.tags (
        created_date Date DEFAULT today(),
        created_at DateTime DEFAULT now(),
        id UInt32,
        hostname String,
        region String,
        datacenter String,
        rack String,
        os String,
        arch String,
        team String,
        service String,
        service_version String,
        service_environment String
        )  ENGINE = MergeTree(created_date, id, 8192);
In most queries CPU table has been joined with tags.
Test Queries
For this benchmark TSBS suggests running 15 different queries, that cover typical scenarios appearing in time series databases, in particular, in monitoring systems.
https://github.com/timescale/tsbs#appendix-i-query-types-
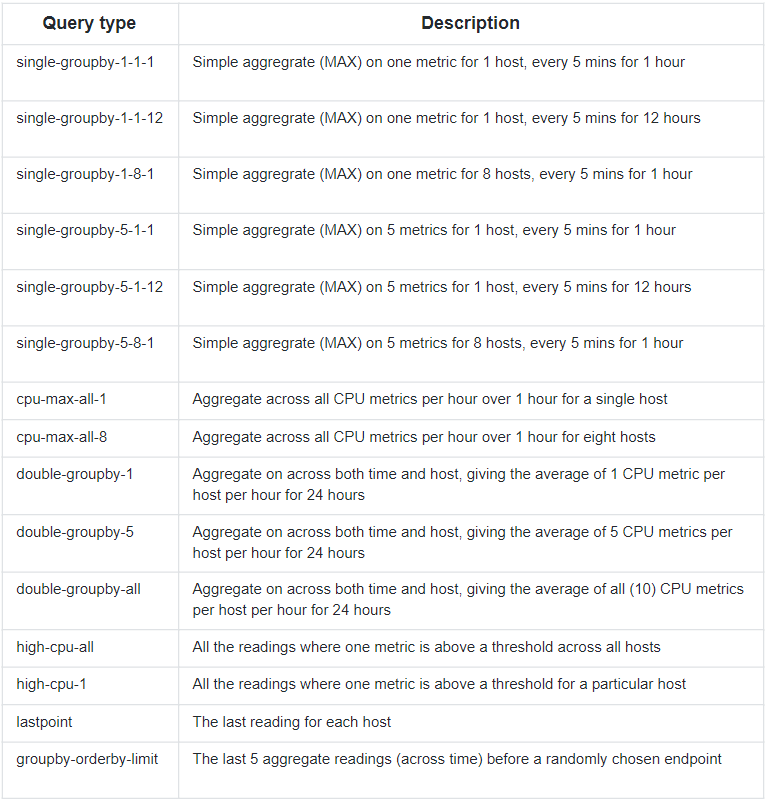
We are not going to list all the queries, here is how first ‘single-groupby-1-1-1’ looks like:
SELECT
        toStartOfMinute(created_at) AS minute,
        max(usage_user) AS max_usage_user
FROM cpu
WHERE (tags_id IN
(
        SELECT id
        FROM tags
        WHERE hostname IN 'host_249'
)) AND (created_at >= '2016-01-03 12:26:46') AND (created_at <     '2016-01-03 13:26:46')
GROUP BY minute
ORDER BY minute ASC
Test setup summary
- Amazon r5.2xlarge instance, 8 vCPUs, 64GB RAM, EBS storage
- A dataset of 100M rows, 10 metrics per row, inserted in batches by 10K rows in 8 parallel workers
- 15 test queries, every query is run 1000 times in 8 parallel workers
Tested databases:
- ClickHouse 18.14.12
- TimescaleDB 0.12.1 w PostreSQL 10.5
- InfluxDB 1.6.4
Every database has been tested independently.
Results
Write performance tests
Write performance tests load 100M rows in batches of 10K rows (so, 10K inserts in total) in 8 parallel streams. We measured the total time that took TSBS to load complete dataset.
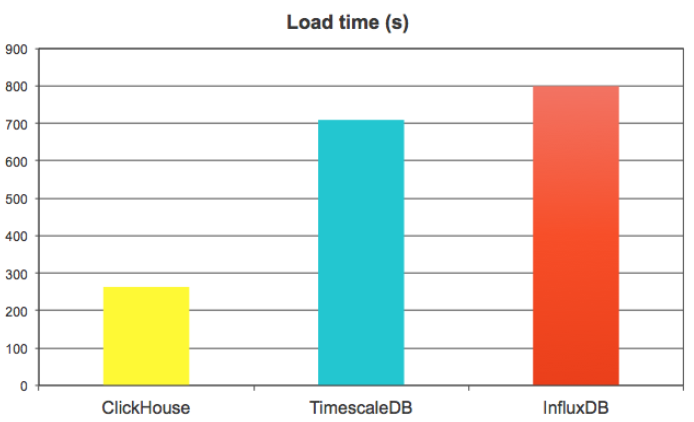

We were actually surprised to see how fast ClickHouse showed in this benchmark, because it does not like small batches, and 10K rows is considered as a small one. ClickHouse has to merge data intensively in the background, and it is still very fast. It was able to load almost 4M metrics/sec, or 400Krows/sec, that is 3 times faster than TimescaleDB and InfluxDB.
We have also looked at data size on disk, and here InfluxDB is the true leader — thanks to efficient time series specific compression algorithms. ClickHouse is 2.5 times behind, but the real outlier here is TimescaleDB — it used 50 times more disk space than InfluxDB and 20 times more than ClickHouse.
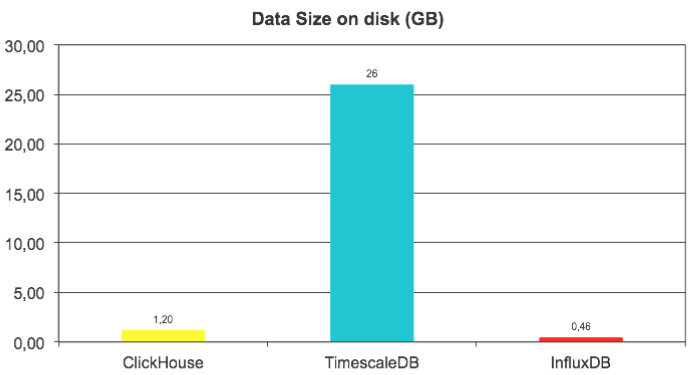
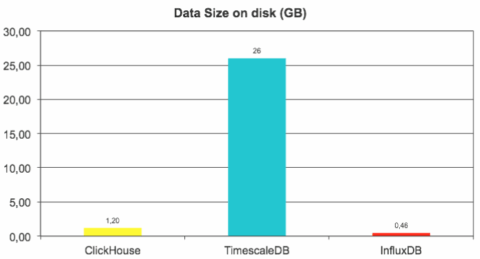
We estimate uncompressed data size as 12GB (reported by ClickHouse), so compression ratio is 1:10 for ClickHouse and impressive 1:25 for InfluxDB.
Query performance benchmarks
Queries have been run type by type, 1000 repetitions in 8 parallel workers. For every query type statistics has been collected by TSBS, and the mean query time has been plotted to the charts below.
We divided the results into two groups for easier presentation:
- “light” queries that typically take milliseconds to complete
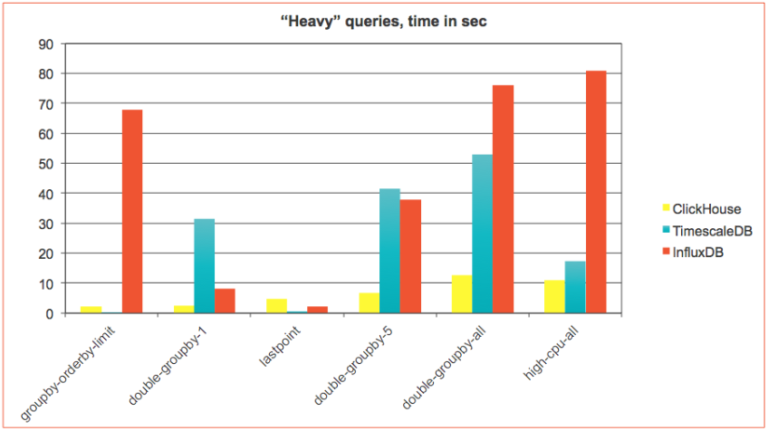
- “heavy” queries that may take single digit seconds or more.

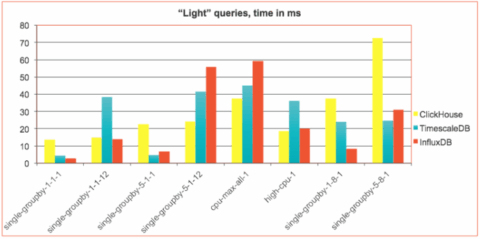

 It turned out, that those two groups demonstrate very different trends. For fastest millisecond queries ClickHouse was usually slightly behind. But as soon as query becomes more complicated ClickHouse takes the lead. This is even more evident for “heavy” queries where ClickHouse significantly outperforms TimescaleDB and InfluxDB with an exception of two query types:
- ‘groupby-orderby-limit’ — The last 5 aggregate readings (across time) before a randomly chosen endpoint
- ‘lastpoint’ — The last reading for each host
Below is the zoomed chart with those two query types, where TimescaleDB significantly outperformed ClickHouse. InfluxDB was very bad on ‘groupby-orderby-limit’ and slightly better than ClickHouse on ‘lastpoint’ so we excluded it from there:
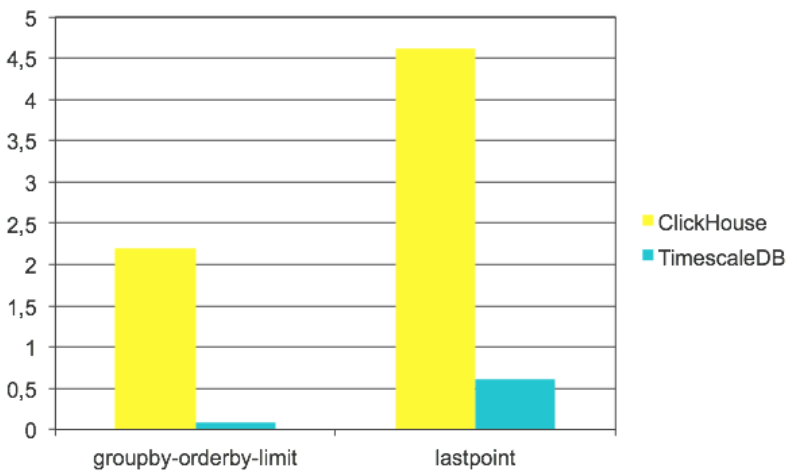
Both query types use the ‘last’ row in time series, and this is what ClickHouse is not very efficient. It can not utilize the index and has to sort the data in order to take the last row. It also can not use dependent joins, that seem to have a huge effect in TimescaleDB case. Let’s look at queries here.
‘groupby-orderby-limit’ looks almost the same.
ClickHouse (2.2 sec):
SELECT
    toStartOfMinute(created_at) AS minute,
    max(usage_user)
FROM cpu
WHERE created_at < '2016-01-03 13:26:46'
GROUP BY minute
ORDER BY minute DESC
LIMIT 5
TimeScaleDB (80 ms):
SELECT
    time_bucket('1 minute', time) AS minute,
        max(usage_user)
FROM cpu
WHERE created_at < '2016-01-03 13:26:46.646325 +0000'
GROUP BY minute
ORDER BY minute DESC
LIMIT 5
The difference here is special “merge append” optimization that TimescaleDB uses for time bucketing. It allows to skip sorting if data is already sorted by time (and it is). Applying the limit to presorted data is very fast.
Queries for ‘lastpoint’ look essentially different:
ClickHouse (4.6 sec):
SELECT * FROM
(
    SELECT *
    FROM cpu
    WHERE (tags_id, created_at) IN
    (
        SELECT
            tags_id,
            max(created_at)
        FROM cpu
        GROUP BY tags_id
    )
) AS c
ANY INNER JOIN tags AS t ON c.tags_id = t.id
ORDER BY
    t.hostname ASC,
    c.time DESC
TimescaleDB (0.6 sec):
SELECT DISTINCT ON (t.hostname) *
      FROM tags t
      INNER JOIN LATERAL (
         SELECT *
           FROM cpu c
          WHERE c.tags_id = t.id
          ORDER BY time DESC
          LIMIT 1) AS b ON true
      ORDER BY t.hostname,
            b.time DESC
In TimescaleDB there is dependent join with LIMIT 1 inside — that returns the last row very quickly using the index. ClickHouse has to calculate the last record by tag_id first, that is pretty fast, but then apply index lookups on the full dataset that takes some time.
For the sake of fair benchmarking, we have not performed any schema optimizations or fine tuning, but it worths mentioning that in ClickHouse we could add special data structure — AggregatingMergeTree Materialized View — that would calculate the last record by tag_id in a separate table, and maintain it up to date automatically in real-time. Such approach allows to reach much better performance on last point queries. We plan to discuss it in the separate article.
Conclusion
ClickHouse did very well against popular specialized time series databases TimescaleDB and InfluxDB. It was significantly faster on data load and provides good data compression, though not as good as InfluxDB. ClickHouse was on par on most of millisecond queries and much faster on heavy queries. However, TimescaleDB has more efficient index structure, more flexible SQL and time series specific optimizations that allows it to be superior on certain types of queries. Since TimescaleDB is an extension of extremely popular PostgreSQL RDBMS, it opens up new capabilities for huge PostgreSQL community. InfluxDB showed its high class as time series DBMS, being a winner on several query types, including the fastest one, though in other cases it did not perform so well.
ClickHouse is a general purpose analytical DBMS. Michael Stonebraker’s “One size does not fit all” certainly holds true, and specialized time series database may be better for some specific use cases. But the difference is not significant, and in a majority of time series scenarios, ClickHouse is a real winner, thanks to its very high performance for general analytics workload. It also scales very easily if one server is not enough. This is already recognized by many companies where ClickHouse is used as a time series backend. It is also integrated to power some high performance monitoring solutions, e.g. there is integration with Graphite — graphhouse, a monitoring system for Kubernetes — loghouse, and a project to replace Prometheus backend with ClickHouse, guess the name, promhouse. The ClickHouse world is being actively populated. Welcome to join!
P.S. See the next article on this topic: “ClickHouse for Time Series Scalability” and “ClickHouse Continues to Crush Time Series”
ClickHouse® is a registered trademark of ClickHouse, Inc.; Altinity is not affiliated with or associated with ClickHouse, Inc.
lastpoint query on clickhouse can work blazing fast with
argMaxfunction, the only limitation – is that it need to list columns explicitly (so you need to use column names, not asterisk).Also LIMIT BY can be more efficient for lastpoint query than select with joins: https://clickhouse.yandex/docs/en/query_language/select/#limit-n-by-clause
We certainly tried argMax() and LIMIT BY — they were inferior in performance to the query we finally used in a test. LIMIT BY was especially slow there.
(TimescaleDB developer here)
This was a good and enlightening benchmark post comparing the raw performance numbers of ClickHouse, TimescaleDB, and Influx. Thank you for that. I think more performance analysis helps everyone in the DB space differentiate and make good decisions.
However, I felt that a major piece was missing: a qualitative analysis of capabilities. For example, the consistency model that TimescaleDB provides is much stronger (full ACID) than either ClickHouse or Influx. The lack of UPDATES and DELETES might, in particular, be a major problem for some ClickHouse users. Also, especially for time-series data talking about the geo-spatial capabilities is important (TimescaleDB supports PostGIS while I don’t think ClickHouse or Influx have a geospatial system that is as advanced.
Some caveats with performance analysis:
For the storage size comparison, we recommend using ZFS or another compressed file system with TimescaleDB if storage size is an issue. That’s how we did our benchmarking, and we’d typically see 3-6x compression.
For inserts, it would be great to see a comparison of performance at different batch sizes. We’ve found that a system that performs well at batches of 10k often does very badly for batch sizes of 1. Both use cases are important in different scenarios/workloads.
It would also be great to have the configuration variables used in each system.
Your conclusion also makes it seem like TimescaleDB limits you to only storing time-series data. I feel it’s important to point out that TimescaleDB is an extension to PostgresSQL and thus you can store both time-series and relational data side-by-side in the same database. This allows you to join relational and time-series data as well as maintain consistency between the two datasets.
But again, I think the above analysis has been really valuable and I don’t want to take away from that. Just wanted to clarify some things and make suggestions for future improvements.
Hi Matvey,
Thank you very much for the answer and TSBS your team is working on! Without TSBS we would never do such a benchmark. And we were actually impressed how TimescaleDB performs in certain types of queries. For database built on top of the other one this is really impressive.
Responding to your comments.
1) Qualitative analysis was out of the scope here, we concentrated merely on benchmarking and applicability, since this is what we are often asked about. But it worths making a note regarding flexibility of TimescaleDB being an extension of PostreSQL. I will add it to the final section right away.
2) For time-series ACID compliance and UPDATE/DELETE functionality is usually not an issue. Partitions work for data retention. And ClickHouse already supports UPDATE/DELETE for occasional data fixes, if necessary.
3) We used defaults for all tests and configurations. Since we are not pro in TimescaleDB and InfluxDB, if we would start tuning anything that would put us in a better position with ClickHouse that we know more about.
It will be interesting to see how much ClickHouse space usage drops once "domain specific compression" support is added.
I’m impressed the space usage while higher than InfluxDB, not impossibly so
Very interesting comparison, thanks!As for me, the main point would be how they all scale out.If ClickHouse is a bit slower for some queries, but scales out better – that would be decision point.
Hi Oleg,Yes, this is exactly what our next article is going to be about. We run the same queries at 3-node cluster to demonstrate it.