ClickHouse® In the Storm. Part 1: Maximum QPS estimation


ClickHouse is an OLAP database for analytics, so the typical use scenario is processing a relatively small number of requests — from several per hour to many dozens or even low hundreds per second –affecting huge ranges of data (gigabytes/millions of rows).
But how it will behave in other scenarios? Let’s try to use a steam-hammer to crack nuts, and check how ClickHouse will deal with thousands of small requests per second. This will help us to understand the range of possible use cases and limitations better.
This post has two parts. The first part covers connectivity benchmarks and test setup. The next part covers maximum QPS in scenarios involving actual data.
Environment
For initial testing I picked in old workstation I had on hand:
- 4-cores Intel(R) Core(TM) i5-2400 CPU @ 3.10GHz
- 8Gb of RAM
- SSD disk
- CentOS 7
This article presents results collected from that machine, but of course it’s very interesting to try to repeat those tests on more capable hardware. I’m leaving that task to our readers, so you can test ClickHouse maximum QPS in a different scenarios on your own hardware. Please post your results if you do! For running benchmarks I also created a set of scripts freely available in Altinity github: https://github.com/Altinity/clickhouse-sts/. Those scripts require Docker (I have v18.09) and Bash. To run the tests suite just clone the GitHub repository and run ‘make test’ command in the root folder. It will execute all the tests on your host (will take a few hours) and put the results into one CSV file which can be analyzed later in Excel, Pandas, or in ClickHouse itself. And of course you can share your findings to compare them to results in this article.
Under the hood those scripts use:
- https://github.com/wg/wrk, a lightweight and fast HTTP benchmarking tool that allows creation of different HTTP workloads
- clickhouse-benchmark tool included in ClickHouse distribution – for native protocol ClickHouse tests
Both tools allow you to create a load of desired concurrency (simulating different number of concurrent clients) and measure the number of queries served per second and latency percentiles.
A few words about handling concurrent requests in ClickHouse
By default ClickHouse can process up to 4096 inbound connections (max_connections setting in server config file), but only 100 queries will be executed simultaneously (max_concurrent_queries), so all other clients will just wait in the queue. The maximum duration of how long client requests can remain queued is defined by setting queue_max_wait_ms (5000 or 5 sec by default). It is a user/profile setting, so users can define some smaller value to prompt an exception in cases where the queue is too long. Keepalive timeout for http connection is relatively low by default – it’s 3 seconds (keep_alive_timeout setting).
There are also a lot of advanced network-related settings to fine-tune different timeouts, poll intervals, listen_backlog size etc.
HTTP ping: theoretically possible maximum throughput of HTTP server
First of all, let’s check how fast the HTTP server used in ClickHouse itself is. In other words, how many ‘do nothing’ requests can the server process.
With HTTP the two main scenarios are important:
- with keepalive (use persistent connection to do multiple requests without reconnecting)
- without keepalive (establish new connection for each request).
Also ClickHouse by default has a very verbose log level (‘trace’). And for each query, it writes a few lines to a log file, which is nice for debugging but of course creates some extra delays. So we also check the same 2 scenarios with logs disabled.
We’ve checked those scenarios on different concurrency levels to simulate different numbers of simultaneously connected clients (sending one request after another). Each test was executed for 15 seconds, and after that average of processed requests per second was taken.
Results:
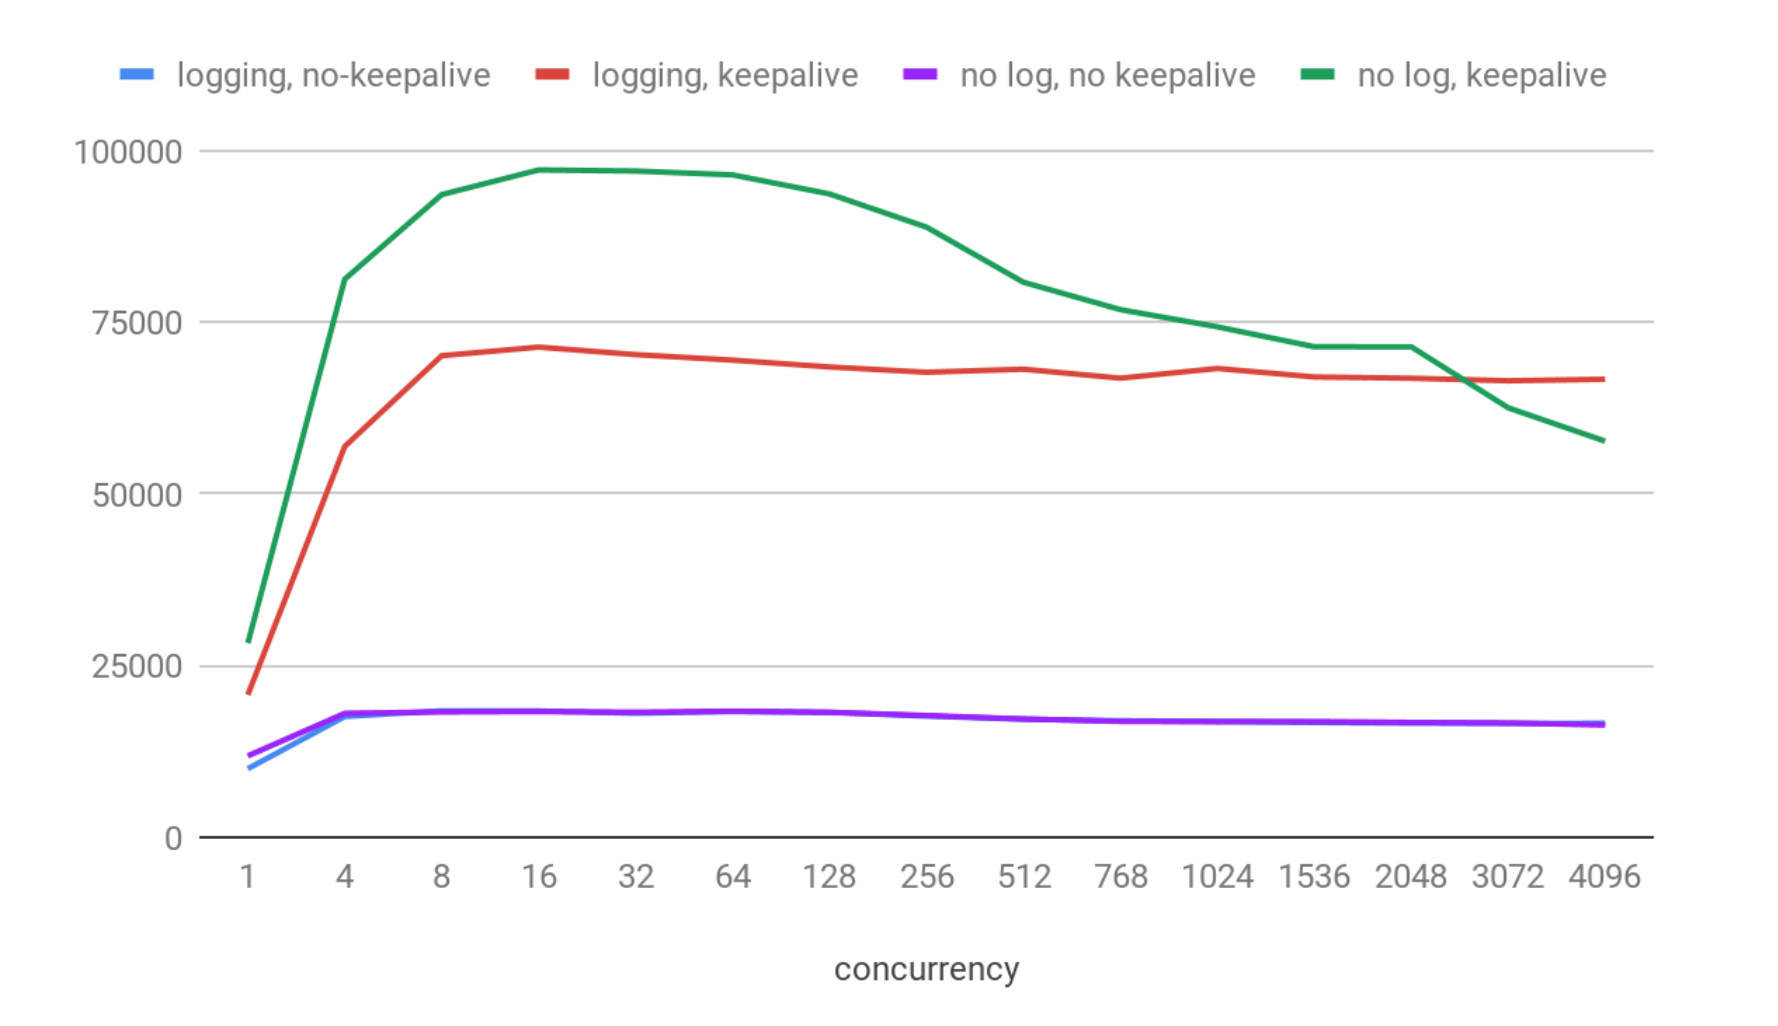
On the X axis you can see the number of clients connected simultaneously. On the Y axis we have the average number of requests per seconds processed in each particular scenario.
Well, results look good:
- QPS has a maximum value between 8 and 64 concurrent connections on that machine in each scenario.
- The maximum throughput was about 97K QPS with keepalive enabled, and logs disabled.
- With logs enabled it was about 30% slower and giving about 71K QPS.
- Both no-keepalive variants are much slower (about 18.5 kqps) and even the logging overhead is not visible here. That is expected, because with keepalive ClickHouse certainly can process many more pings thanks to skipping the extra cost of establishing a connection for each request.
Now we have a feeling for the maximum theoretically possible throughput and concurrency levels which ClickHouse web-server can achieve. In fact, the ClickHouse HTTP-server implementation is quite fast. For example, NGINX with default settings on the same machine can serve about 30K requests per second.
SELECT 1
Let’s go one step further and check a trivial ‘SELECT 1’ request. Suche queries are ‘executed’ during query parsing phase, so that will show the theoretical maximum throughput of ‘network + authorization + query parser + formatting result’, i.e. real requests will never be faster than that.
We will test http and https using keepalive and no-keepalive options, and native client (both secure and non-secure).
Results:
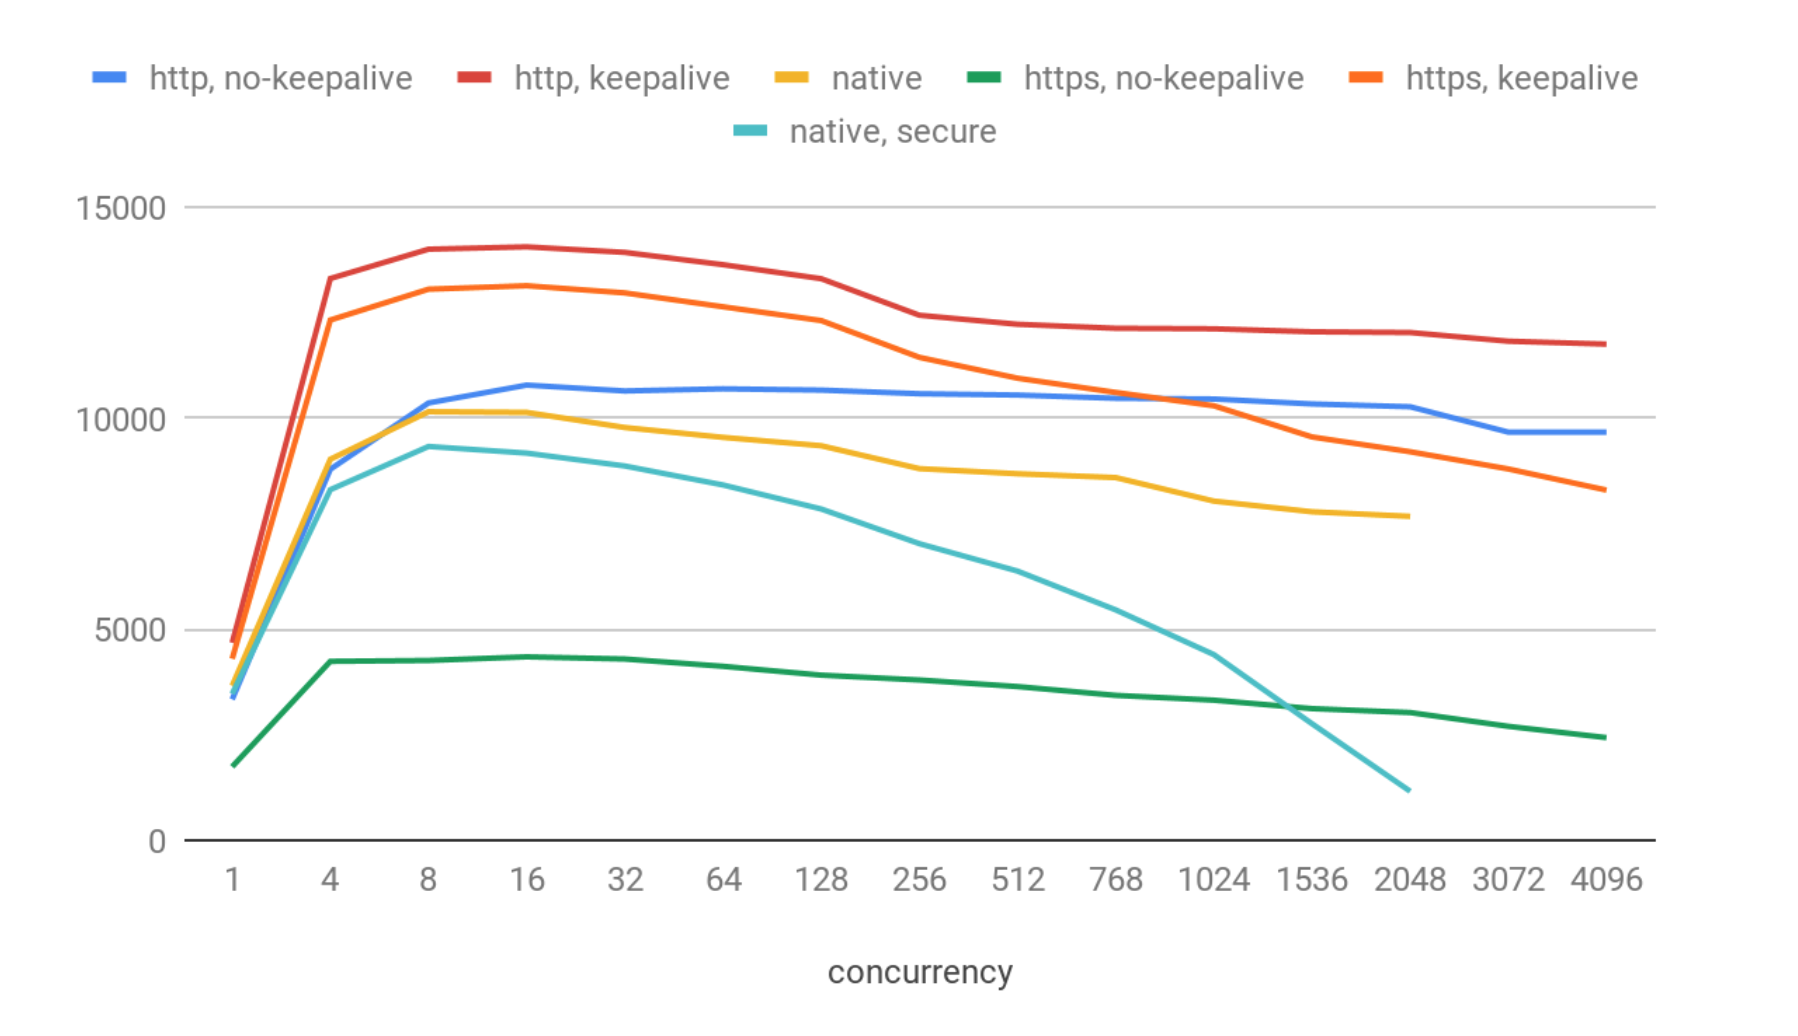
These results show quite a big degradation compared to simple pings. We’ve got:
- about 14K QPS for the best case: http & keepalive.
- bit worse (13K QPS) in the https & keepalive case. Https overhead is not significant in that case.
- 10.7 kqps for http no-keepalive.
- 10.1 kqps for native (no secure).
- 9.3 kqps for native (secure)
- And quite poor 4.3 kqps for https no-keepalive
On the highest concurrency levels we registered a few dozen of connection errors (i.e, less than 0.01%), most probably caused by socket reuse issues on the OS level. ClickHouse itself behaved stably in that test, and I didn’t register any visible issues with it.
It can be surprising that the native protocol shows worse performance than http, but actually it’s expected: native TCP/IP is more complicated and has a lot of extra protocol features. It is not well-suited for high QPS but rather for transferring back and forth large chunks of data.
Also there is a quite significant QPS degradation when concurrency grows in the native client, with higher concurrency levels (>3000). At this point the system becomes unresponsive and returns no results. Most probably it is caused by the fact that clickhouse-benchmark tool uses a separate thread for each connection, and that number of threads and context switches is too much for the system.
Now let’s take a look at latencies, i.e. how long each client waited for the answer. That number varies in each request, so the chart shows 90th percentile of the latency in each case. That means that 90% of users get the answer faster than shown number.
Latencies (90th percentile) – 1-256 concurrency levels
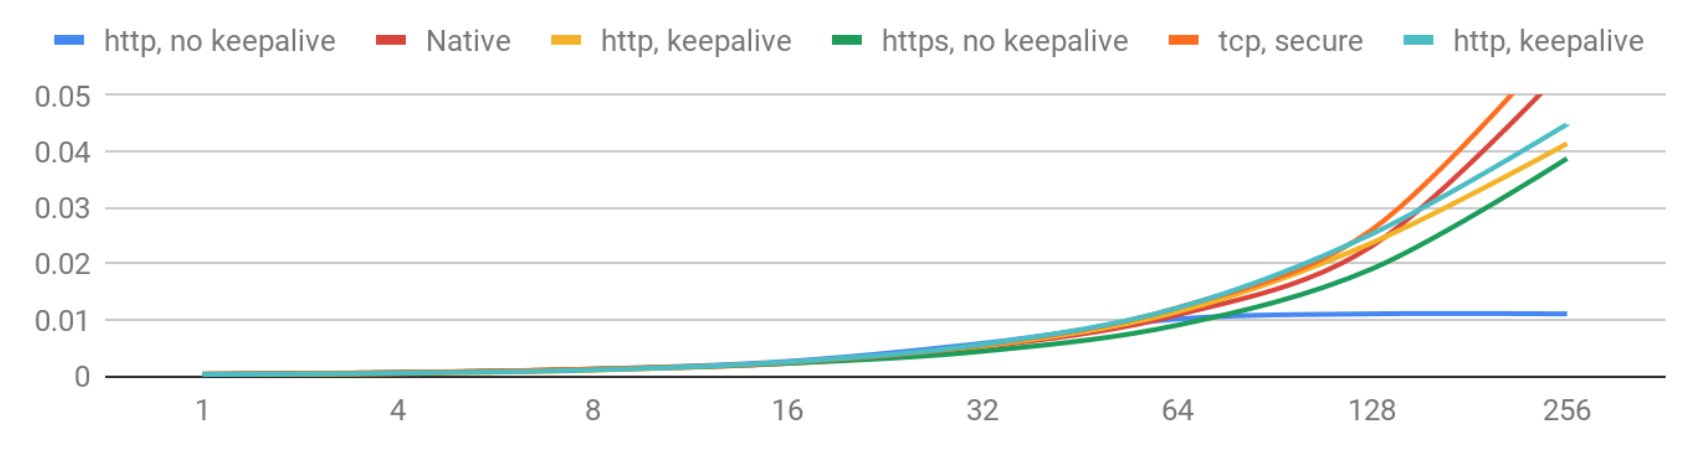
Latency degradation with growing concurrency is expected. And for now it looks very good: if you have less than 256 concurrent users you can expect the latencies below 50 ms.
Let’s see how it goes with higher concurrency.
Latencies (90th percentile) – >256 concurrency levels
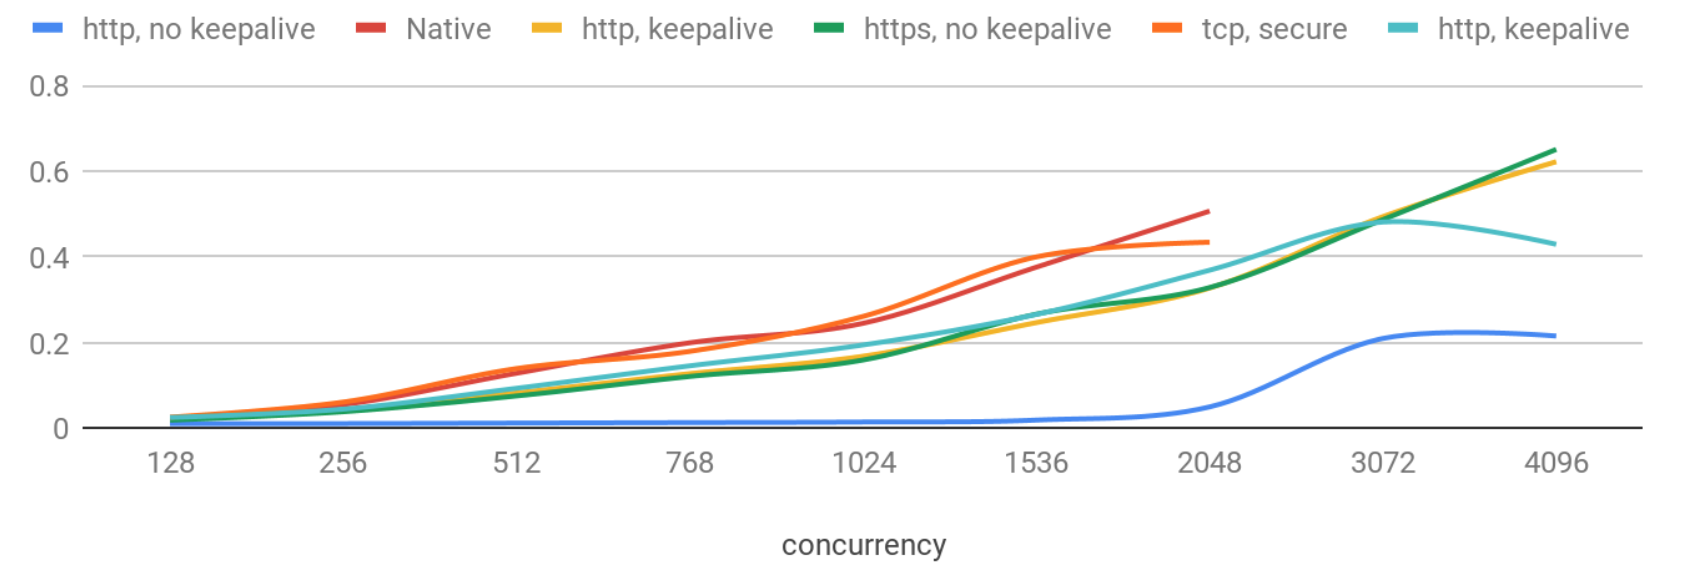
Now latency degradation is more significant, and again the native protocol shows the worst results.
It is quite interesting that http requests with no keepalive behave very stably and give latencies below 50ms even with 2K concurrent users. Without keepalive latency is more predictable and stdev stays small as concurrency increases, but with some lower rates of QPS. It may relate to implementation details of the webserver: for example when one thread per connection is used, thread context switches can slow down server and increase latency after a certain concurrency level.
We have also checked other settings like max_concurrent_queries, queue_max_wait_ms, max_threads, network_compression_method, enable_http_compression and a few output formats. The effect of adjusting them in this scenario was mostly negligible.
Effects of multithreading
By default ClickHouse processes bigger queries using multiple threads to use all CPU cores efficiently. Yet if you have a big number of concurrent connections, multithreading will create extra costs on context switching, rejoining threads, and synchronization of work.
To measure the interaction of concurrent connections and multithreading let’s look at the difference in a synthetic select for finding maximum of 100K random numbers with default multithreading settings and with max_threads=1.
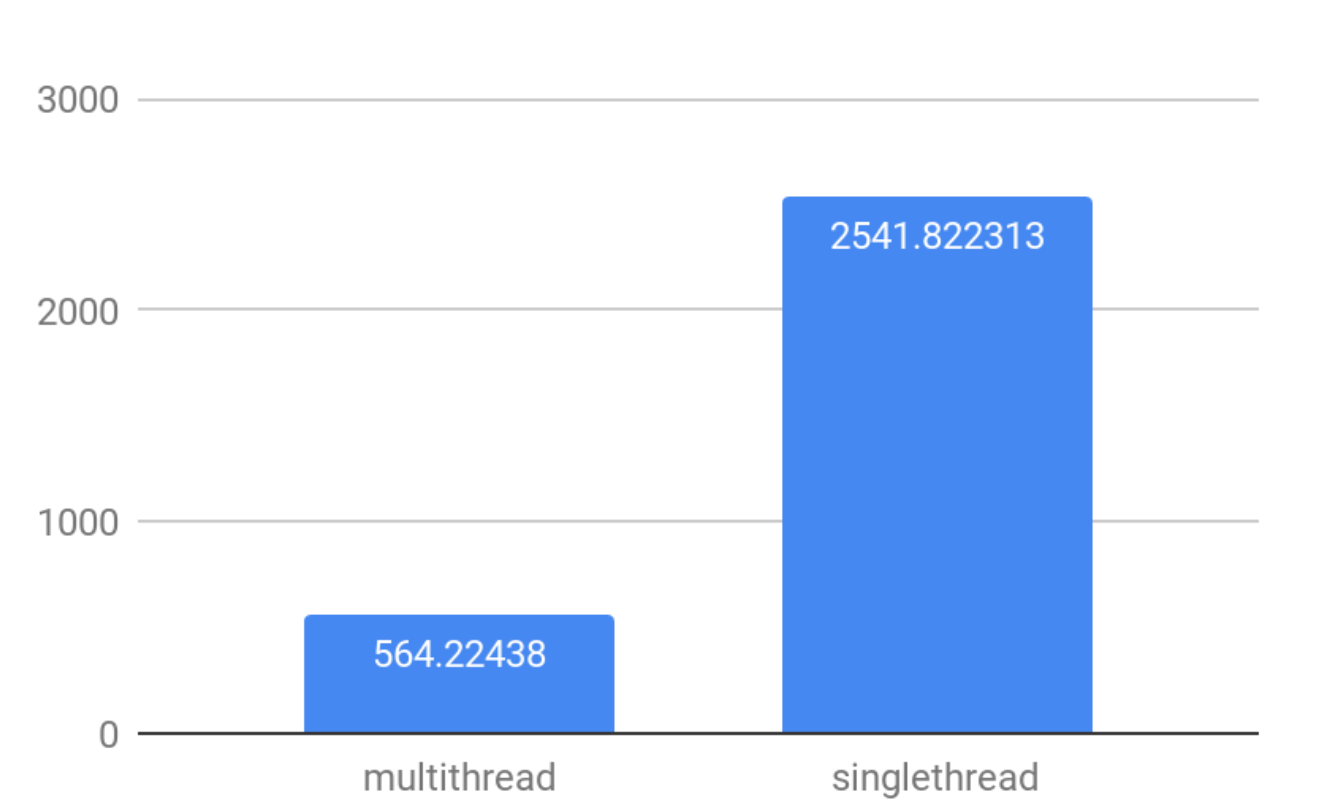
The conclusion is quite simple: to achieve higher QPS in high concurrency scenarios, use max_threads=1 setting.
To Be Continued…
This article covered the general connectivity testing of ClickHouse. We checked how fast the server itself is, how many simple queries it can process and which settings affect the QPS in high concurrency scenarios. See the follow-on post where we dig into estimating maximum QPS of real queries in key-value scenarios, which add data to the test cases.
ClickHouse® is a registered trademark of ClickHouse, Inc.; Altinity is not affiliated with or associated with ClickHouse, Inc.
One Comment